uNagi * Step by step
Whatch the showcase of uNagi on YouTubeCapabilities / use cases
User interface components
Host and service flags
Notification icons and their meaning
Home screen widgets
Settings, configuration
Shell commands
What you can do with uNagi:
- Monitor several Nagios / Icinga accounts
- Perform various actions on the monitored accounts, such as
- browse the status information, flag info and comments of picked hosts and services
- acknowledge problems / remove acknowledgement from acked hosts/services
- add / remove comments from hosts / services
- (force) recheck hosts, services
- enable / disable notifications on hosts, services
- send custom notification on hosts, services
- schedule downtime on hosts or services
- perform mass actions on all services of the targeted host
- browse among the notifications issued for the current account, with archive access and contact name filtering
- view PNP or NagiosGrapher charts of the targeted host (needs PNP4Nagios, respectively NagiosGrapher plugin installed)
- open the selected host's / service's status page in a browser window
- Select your services of choice, and register them for private uNagi sound and/or vibrate alert when a problem arises on them
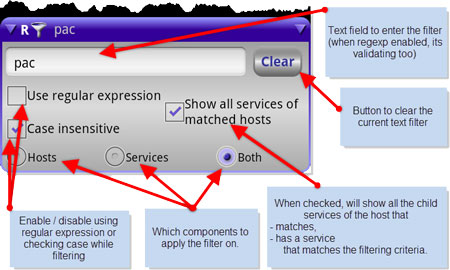
- Filter the displayed hosts and their services based on
- their status (checking whether they have problems or not)
- a text you define; here you can choose where to apply your text-filter, and whether to use regular expressions or not
- Control uNagi from shell: start, silent-start, stop (more coming soon)
Let's take a look at the main (visual) components of the application:
Components:
- When you start the application for the first time, an ["Add new account"] dialog appears, which you should fill:
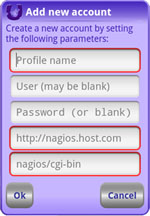
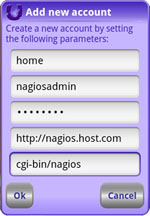
- Specify a unique name for your profile
- Enter the user name and password you use to access
the desired Nagios or Icinga installation.
Note, that these credentials will be handled securely. - Specify the url to your Nagios/Icinga host
(the doc root) - Specify the relative url of the cgi directory
(relative to the Nagios host) - Tap on the Ok button to save this account
If you have at least one profile saved, this dialog won't appear on the startup anymore, but you'll still be able to access it from the ["Start uNagi"] dialog, or via ["Settings"]
- If you cannot get uNagi load your data, and you're getting errors on connection to your Nagios server, please take a look at this FAQ and answer
- If your account is successfully created, and your data is loaded, but you experience problems loading the graphs or the icons, this FAQ and its answer might help clearing up things
- If taping Ok, a ["Start uNagi"] dialog will appear listing all the accounts (profiles) you've saved so far':
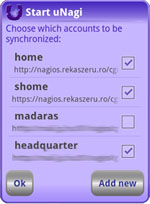
- Select all the profiles you want to monitor
The checkboxes near them should be checked. - Hit the ["Add new"] button if you'd like to create more profiles
- Tap on the Ok button to start monitoring the chosen accounts
- Select all the profiles you want to monitor
- When selecting the Ok button, the application's main window comes in front:
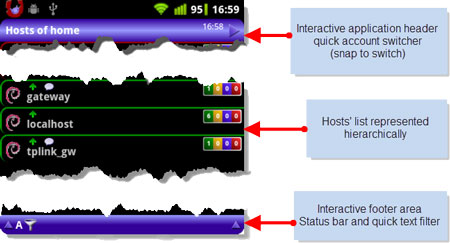
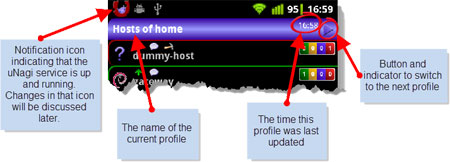
- The ["Header"] component
(also serving as quick view switcher) - The ["List"] component
- The ["Footer"] component which
serves as quick text filter host
and status bar
This window consists of three major
interactive components:Header:
List of hosts:
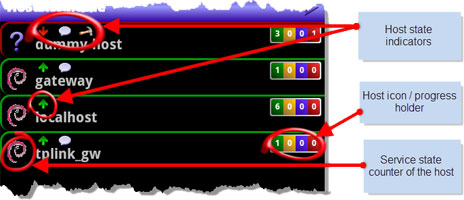
Hierarchical list of hosts:
Footer:
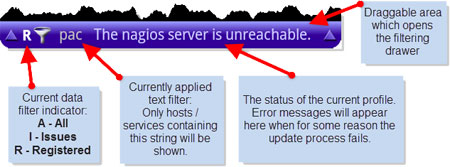
Footer expanded:
- The ["Header"] component
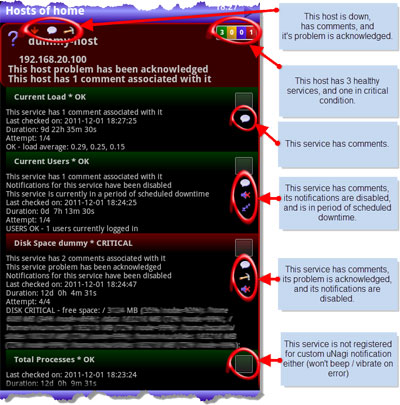
Host and service flags:
Here are listed all the flags that may appear above a host or near a service components:
- Comments / Notes
The host / service denoted by this icon has comments and/or has notes attached
- Acknowledged
The component's problem(s) have been acknowledged.
- Flapping
The component is flapping between states.
- Notifications disabled
The notifications for this component are currently disabled.
- Downtime
The component is currently in a preiod of scheduled downtime.
- Up
The host is healthy (Up)
- Unreachable
The host is Unreachable
- Down
The host is Down
Notifications:
The following icons denote the different notifications appearing in the phone's notification area, and explain what they mean.
Notifications are only shown, if the Settings / Use background service is checked. They show the status of the uNagi service:
- Connecting
The service is attempting to connect to the Nagios/Icinga server.
- Disconnected
The service has been recently disconnected from the Nagios/Icinga server.
- No network connection
There is no network connection available, so the service is unable to connect to the Nagios/Icinga server.
- Loaded
The service has loaded the list of hosts and services from the server.
In each case above the red U means that at least one of the hosts/services is not healthy.
Widgets:
uNagi provides three application widgets in three sizes;
Each widhet shows the status of one chosen Nagios account in two columns:
- on the left column appears the hosts' status:
Up, Unreachable, Down
- on the right column appears the services' status:
Ok, Unknown, Warning, Critical
On the bottom part of the widget the name of the chosen Nagios account is shown.
The icon of the widget shows the summarized status of this account (as explained in the Notifications section)
They come in two background styles: opaque and not that opaque.
If the account targeted by the widget could not be updated, and has any error information in its status, that message will appear on the widget.
Settings, customization:
The uNagi's application settings are portiond in four major sections:
- Global settings
- Account management
- Current account
- uNagi alerts
- Error handling
- Backup / restore / share preferences
1. Global settings:
Within this section you can set preferences that will be applied globally over the application.
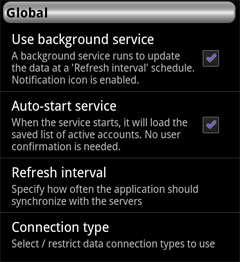
With the Use background service checkbox you can control the manner uNagi updates the active accounts, and also whether an icon appears on the notification are.
In use-service mode (when background service is enabled), by the Auto-start service preference you can control whether the application to start with the saved list of active accounts, or pop up the list of specified accounts, and let you select / confirm the ones to be active.
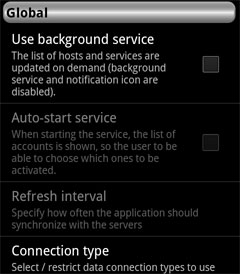
Under the Refresh interval preference you can set the number of minutes the uNagi service will try to actualize the data of the Nagios and Icinga accounts. This is only enabled if the service is allowed to run.
The Connection type contains the settings to define what kind of data connections would you prefer using:
- wifi,
- mobile network, and if so
- with / without roaming
1.1. More global settings:
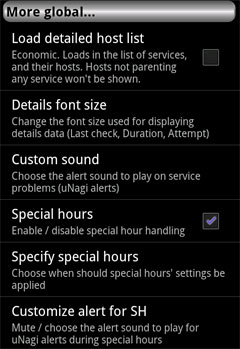
The Load detailed host list preference, if checked, retrieves additional information on the list of
hosts, such as last check time, duration, etc. Also, the hosts that are not directly parenting at least one service, still
appear in the list, not only on the notification area and widget.
This feature is disabled by default, since it means more load on the data traffic.
The Details font size preference allows you to increase/decrease the font size in which the service details are listed.
With the Custom sound preference you can select the sound that will be played when an uNagi alert occurs.
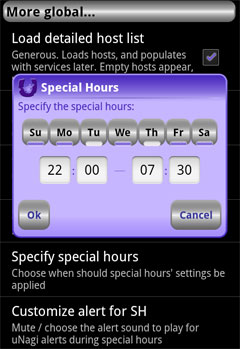
Under the Special Hours preferences you can specify the day / time intervals, during which a custom alerting scheme will be applied. This can be set via the Customize alert for SH (Special Hours) setting.
2. Account management:
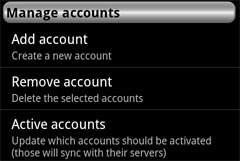
In this section you can deal with your Nagios and Icinga accounts:
- create new ones,
- remove unwanted ones,
- activate or deactivate selected accounts
each with checkable lists
3. Current account:
In this part of the settings you can handle the account you were watching right before accessing the preferences page.
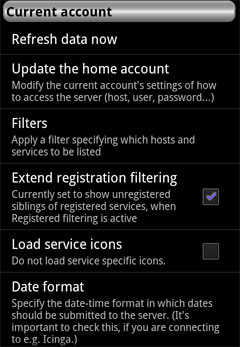
By selecting Refresh data now you can request an on demand update of the current account's data.
Selecting the Update the xxxxxx account you can review the configuration of the current account, modify the access parameters, such as the host, the cgi-bin path, the user name or the password.
The Filters preference lets you control which filter to be applied on the current account. This can be done directly from the Menu -> Account -> Filter by state as well: A - All, I - Issues, R - Registered.
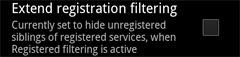
The Extend registration filtering configuration has only effect if the Registered filtering is active. If checked, allows you to list all the siblings of services that are registered, regardless whether they are not.
By the Load service icons setting you can enable / disable loading and displaying the icons you've defined for individual services from your Nagios / Icinga configuration.
Under the Date format preference you can specify the date-time format to be used when requesting/sending dates from/to the server.
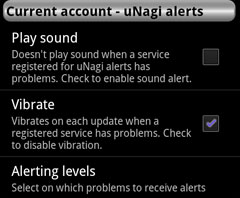
4. uNagi alerts:
Here you can set how you want to be notified, when a service registered for uNagi alerts has problem.
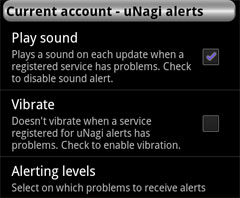
The Play sound and Vibrate settings are pretty obvious. They will alert you by sound / vibration, if a service registered for uNagi alert has issues, and its status level is checked in the Alert levels preference below.
In the Alert levels you can set the level of problem on you need alerts: any combination of Unknown, Warning and Critical is accepted.
In addition, as of version 1.3.7, you can also specify, whether the server-side notifications to be monitored or not, and
they should be checked before alerting or not:
- alert only when a server-side notification arrives,
- keep playing the alert until you check the notifications at Menu -> Account -> Load notifications.
5. Error handling:
This section lets you deal with any malfunction / error / odd behavior of the application.
If you feel a problem is hard to describe, difficult to reproduce, or don't have the time to drop a note about it,
but still would like to make uNagi better, please just simply enable reporting, and I will look into it. Thank you very much!
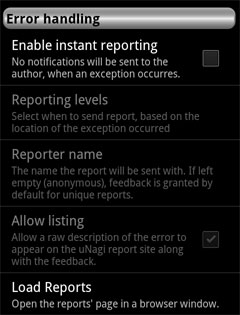
If you experience any of the behaviours above, please check the Enable instant reporting
checkbox, by that allowing the application to send me the cleaned-up stack traces. By them I can learn what causes
the problem, and if there is anything I can do to fix it / prevent it, it will be done by the next release.
A cleaned-up stack trace means that it is free of any personal, sensitive information, only debug information are submitted.
Under the Reporting levels settings you can configure from where to send reports of errors arisen: the user interface, the service or connection handling.
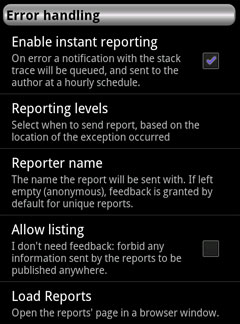
The reporter name is an optional setting, which should be filled only in case you'd like to have feedback
on the problem you are experiencing.
In most of the cases feedbacks are simple checkmarks ( ) on the Reports page,
denoting whether the issue was handled or is still pending.
Still, if a common error appears, that can be / should be handled from your side,
that's the place where you can hear about it. These kinds of feedbacks are marked with a user icon:
) on the Reports page,
denoting whether the issue was handled or is still pending.
Still, if a common error appears, that can be / should be handled from your side,
that's the place where you can hear about it. These kinds of feedbacks are marked with a user icon: 
By checking the Allow listing checkbox, you allow the (unique) errors reported by you to be listed on the Reports page. If the reporter name is left empty, this setting is on by default.
And at the end a pretty obvious action preference: by selecting the Load Reports, the Reports page will be opened in a browser window.
6. Backup / restore / share application preferences:
At this preference section you can manage your application / account preference backups: create new ones, share them, ore restore older states.
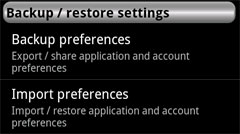
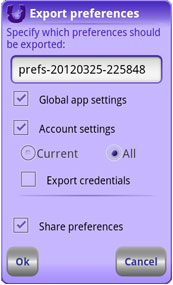
By selecting the Backup preferences item, you'll have to chose which particular data you'd like to be saved (as seen on the right image). A preference file will be created with the chosen name in the application directory, on the sd-card.
You can also restore saved preferences, by selecting the Import preferences item.
Only files placed under the sdcard/unagios/data directory are available to load in (at the moment).
Shell commands:
The following commands can be used from shell (or Tasker / Locale) to start or stop uNagi:
- To start the application with gui: am start -n ro.rekaszeru.unag/.activity.ActivityMain
- To start the application without gui: am start -n ro.rekaszeru.unag/.activity.ActivityMain --ez silent true
- To stop the application and/or the service: am broadcast -a ro.rekaszeru.unag.StopServiceAndApp