Reported problems, questions, answers and solutions:
There is no question small enough for me to leave it unanswered, so pleasecontact me if you have ANY kind of problem / confusion about uNagi!
all versions2 questions
-
[Steven Brown: Feb 10, 2012 03:04:00 | 1.2.1]
- Why do I get Error Code 404 on loading PnP4Nagios graphs? [Austin Arbour: Jan 21, 2012 20:24:00 | 1.0.37]
- What does the icon next to each host mean, in my case a question mark?
On the left side of each host / service there is a place to show the icons attached to these components -if any-
If a host does not have an icon specified for it, a question mark appears instead of the icon.If you
- have icons specified and they don't appear OR
- can access the PnP4Nagios / NagiosGrapher graphs from your browser, but they won't display in uNagi,
you should know, the the locations for the icons / graphs are specified relatively to the Nagios installation home, and if it is not entered correctly, the useful data might still be loaded, but neither the icons nor the graphs will get displayed (they won't be found);
To ensure you have a proper account setup in uNagi, you should take a look at
Menu --> Settings --> [Current Account]Update the * account
In most of the times the problem is a setup similar to this:
- Nagios host: http://my.host.com/nagios
- cgi directory: cgi-bin
when the icon and graph locations also contain the /nagios prefix, so it will be duplicated, e.g:
- http://my.host.com/nagios/nagios/icons/logos/linux.png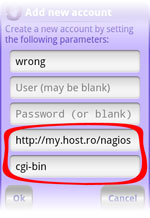
In this case the following setup template will work as expected
- Nagios host: http://my.host.com
- cgi directory: nagios/cgi-bin
the icons and graphs now will be loaded from their actual location:
- http://my.host.com/nagios/icons/logos/linux.png
- http://my.host.com/pnp/image?...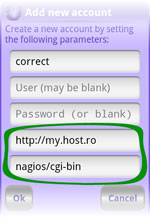
all versions5 questions
-
[nag: Feb 04, 2012 12:39:41| v1.1.1]
- Connection error: [Host name may not be null] / [Target host must not be null, or set in parameters]
- neither the host
- nor the cgi dir field is empty.
- the host field starts with the proper scheme (http:// | https://)
- your host name should be http://192.168.1.2 [or https://192.168.1.2]
- and the cgi directory should point to the location of the status.cgi, e.g.: nagios/cgi-bin
[Phil: Jan 10, 2012 19:06:23| v0.9.99]
[nok-2519: Jan 2, 2012 09:17:37 | v0.9.98]
[anonymous: Dec 27, 2011 17:10:04 | v0.9.96]
[Jean Michel: Dec 17, 2011 19:35:21 | v0.9.94]
If this message appears on your uNagi main screen / widget, you should examine 3 things (hopefully one of them will be the solution);
Check your connection parameters via Menu / Settings / Update account, and make sure
Schemes (protocols) must always be included in the host name, because that's the way I figure out if your connection is secured (over 443) and accepts certificates, or not.
In case you are using an ip address (e.g. no dns server for internal addresses): 192.168.1.2,
v1.3.02 reports
-
[anonymous: Feb 16, 2012 18:34:38]
- NPE on displaying the error message when an action on a host / service fails
fixing for next version [1.3.2]
v1.1.41 report
-
[anonymous: Feb 13, 2012 16:34:59]
- NPE on saving activity state (e.g. on device rotation), while a popup is shown
fixed as of version 1.3.0
v1.1.11 report
-
[Steven Brown: Feb 06, 2012 19:40:38]
- some PnP graphs -for services- won't appear
fixed as of version 1.2.1
v1.0.311 report
-
[white_wyrm: Jan 16, 2012 -comment-]
- Settings / configurator is buggy.
v1.1.11 report
-
[David Precious: Jan 31, 2012 10:09:08]
- Invalid index error when fetching host updates while applying a filter.
The solution is included in the release v1.1.4.
v1.0.41 report
-
[Zsolt: Jan 24, 2012 19:57:00]
- ICS Launcher Force Closes when using widgets
This problem has been solved as of version 1.0.5.
v1.0.371 report
-
[anonymous: Jan 22, 2012 12:08:53]
- bein profilnamen eintippen Absturz!!
BadTokenException: Unable to add window - when specifying account name
BadTokenException: Unable to add window -- working on it!
v1.0.32 reports
-
[Andrew: Jan 14, 2012 -comment-]
- FC on account update
The error occured on version 1.0.3, due to a validity check upon the account names that should be updated.
It is now fixed, and also assured, that only existing accounts will get through the uNagi - plug-in interface.
Thank you very much for such fast reactions, it helped me point out the bug, and heal it fast!
[anonymous (4): Jan 14, 2012 22:29:51]
v0.9.991 report
-
[nok-2519: Jan 7, 2012 19:11:36]
- FC NPE on change filtering in Settings of the current account that has also been deactivated
v0.9.965 reports
-
[anonymous: Jan 13, 2012 18:38:58| v1.0.2]
- FC on manipulating account data (popup handling)
This error was pretty hard to locate, since I could not reproduce it, and took time until I found deep-explanations on what might cause the issue. For more details please see Dimitar Darazhanski's blog entry on this topic. The error will be fixed in the next (1.0.35) version;
[anonymous: Jan 10, 2012 18:55:08| v.0.9.99]
v0.9.951 report
-
[anonymous: Dec 24, 2011 15:07:32]
- Error connecting to Nagios over https with certificate chain
v0.9.943 reports
-
[anonymous: Dec 22, 2011 4:43:30]
- FC when stopping the service / closing the application [anonymous: Dec 15, 2011 2:59:25]
- FC when switching views
[anonymous: Dec 16, 2011 5:07:26]
v0.9.921 report
-
[anonymous: Dec 10, 2011 14:18:57]
- FC on application start with invalid account name
v0.9.91 report
-
[anonymous: Dec 7, 2011 23:15:45]
- FC NPE on removing / deactivating an account currently being updated
v0.9.81 report
-
[anonymous: Dec 3, 2011 17:52:27]
- FC NPE on removing / deactivating an account currently being updated
v0.9.61 report
-
[anonymous: Nov 25, 2011 5:53:08]
- FC NPE on main activity restart (intent not initiated)